Introduction
Pix4D is a a software program which converts aerial, oblique, and ground imagery into highly accurate georeferenced orthomosaics, 3D surface models, point clouds, contour lines, and more. Pix4D can process data taken from any type of camera. Most images are taken from UAS platforms, but can also be taken from aircraft. In this lab, aerial imagery from the Litchfield mine located south and west of Eau Claire will be used. This imagery was collected in June of 2016 using the Phantom platform. The purpose of this lab is to process this imagery using the Pix4D and describe the process. It is also to generate maps from this processed data. The patterns in these maps will then be described. Before processing the data though, some basic questions will be answered below.
What is the overlap needed for Pix4D to process imagery?
Generally, the minimum overlap needed to produce quality data is 75% frontal (in the flight direction), and 60% side (between flying tracks).
What if the user is flying over sand/snow, or uniform fields?
Because the data points would be more difficult to distinguish in these area if a normal flight was taken, it is recommended that to get quality data, the UAS platform be flown higher off the ground and that the minimum overlap is 85% frontal, and 70% side.
What is Rapid Check?
Rapid Check is a software which can be used in the field to quickly see if the data collected from the UAS platform was sufficient enough. Unfortunately, the results are not always accurate because it processes the the quality of the data very quickly.
Can Pix4D process multiple flights? What does the pilot need to maintain if so?
Yes. Pix4D can process multiple flights. The pilot needs to make sure that there is sufficient overlap between the flights, and that the flights are taken under very similar conditions (sun angle, weather, traffic, etc.).
Can Pix4D process oblique images? What type of data does one need if so?
Yes. Pix4D can process oblique images. Multiple images need to be taken at different angles for oblique images to create a quality output. It is recommended that images be taken every 5 to 10 degrees to provide enough overlap between images.
Are GCPs necessary for Pix4D? When are they highly recommended?
No. GCPs are not necessary for Pix4D. However, it is strongly encouraged that GCPs be used when combining oblique imagery with aerial imagery.
What is the Quality Report?
The quality report is a report which is automatically displayed once the Initial Processing is completed. It gives the description and status of the images, dataset, camera optimization, matching, and georeferencing. This report allows the user to see if the data is ready for further processing.
Methods - Processing the Data
Step 1: Create a New ProjectFirst, Pix4DMapper is opened and a new project is created. It is given the name 20160616_hadley_phantom50m. The reason for this folder name is so information about the flight is easily known. The name includes the date of the flight, the location of where the flight was, the platform that was used, and the height at which the platform was flown.
Step 2: Add Images:
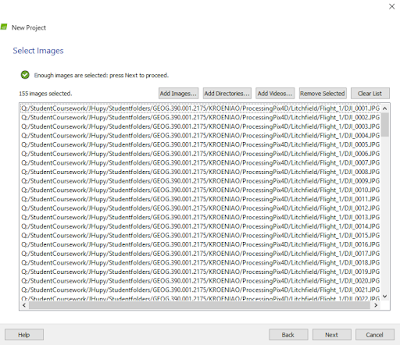
Next, images have to be added. Images, from both the Flight_1 and Flight_2 folders were added. This can be seen below in figure 3.0. In total, 68 images were added from the Flight_1 folder, and 87 images were added from he Flight_2 folder.
 |
| Fig 3.0: Add Select Images |
Pix4D automatically assumes some camera settings based on the photos, but unfortunately these aren't always correct. For example, in this project the camera settings regarding the shutter model needed to be changed from "Global Shutter or Fast Readout" to "Linear Rolling Shutter". This change is circled below in figure 3.1.
 |
| Fig 3.1: Edit Camera Properties |
This can usually be left to the default settings. In this project the default was WGS84/UTM zone 15N. Even if this isn't the best coordinate system to use, the coordinate system can always be re-projected in ArcMap once the rasters are created.
Step 5: Choose a Processing Template
For this project the 3D Maps template was chosen. Choosing this output template will create a DSM, and and orthomosaic using the images added previously.
 |
| Fig 3.2: Unchecking Future Processing |
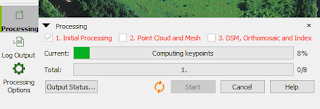
It is usually smart to separate the initial processing from the point cloud, and DSM/orthomosaic processing. This way, if any issues arise in the initial processing, less time is wasted as processing can take a bit of time. To make sure that only the initial processing takes place first. The two check boxes need to be unchecked as shown on the right in figure 3.2. Separately, in the processing options window under DSM, Orthromosaic and Index options, the method is changed to Triangulation. Now. the data is ready for initial processing. Figure 3.3, shows where progress of the processing can be tracked. In this figure currently 8% of step 1 of 8 is complete.
 |
| Fig 3.3: Initial Processing Progress |
Step 7: Examining the Quality Report
After initial processing is complete, a Quality Report is automatically generated. This report lets the user know whether the data is ready for further processing or if it isn't. It gives details about the accuracy of the data. Below, in figure 3.5 is the summary section of the Quality Report. This summary includes the duration of the processing, the area covered, the time of the processing, the project name, the name of the camera, and the average ground sampling distance.
 |
| Fig 3.4: Summary of the Quality Report |
 |
| Fig 3.5: Quality Check Section of the Quality Report |
 |
| Fig 3.6: Overlap Section in the Quality Report. |
Step 8: Start Point Cloud and Mesh, and DSM, Orthomosiac, and Index Processing
If the Quality Report looks good, like it does in this case, the data is ready for further processing. To make sure Initial Processing doesn't repeat, that check box can be unchecked. Once the 2. Point Cloud and Mesh and 3. DSM, Orthomosaic, and Index boxes are checked the data is ready to be processed again. After this processing is complete, the data will be ready for map making.
Results/Discussion
 |
| Fig 3.7: Product After Processing |
 |
| Fig 3.9: Orthomosaic Overlaid with a Hillshade of the Litchfield Mine |
 |
| Fig 3.10: Digital Surface Model of the Litchfield Mine |
Conclusion
In conclusion, Pix4D is a good way to process data collected from UAS platforms. The software has a nice user interface which with just given little direction can be easily used. Pix4D is a very powerful software. This lab consisted of creating DSMs and orthomosaics, but these are just a couple of things Pix4D is capable of doing. Creating the DSMs and orthomosaics from a collection of many images allows for data analysis which would otherwise be not possible. Another important aspect about Pix4D is the rapid check function. This allows the user to know if the data collection is of good quality while in the field. This can be very useful especially if the data quality is in question to start with.Sources
Pix4D User Manual Desktop Manual PDF
Pix4D Quality Report Help
No comments:
Post a Comment